CoinLoan Weekly: BTC’s return to green, silver lining, stablecoin reshuffling

Price dynamics
BTC price
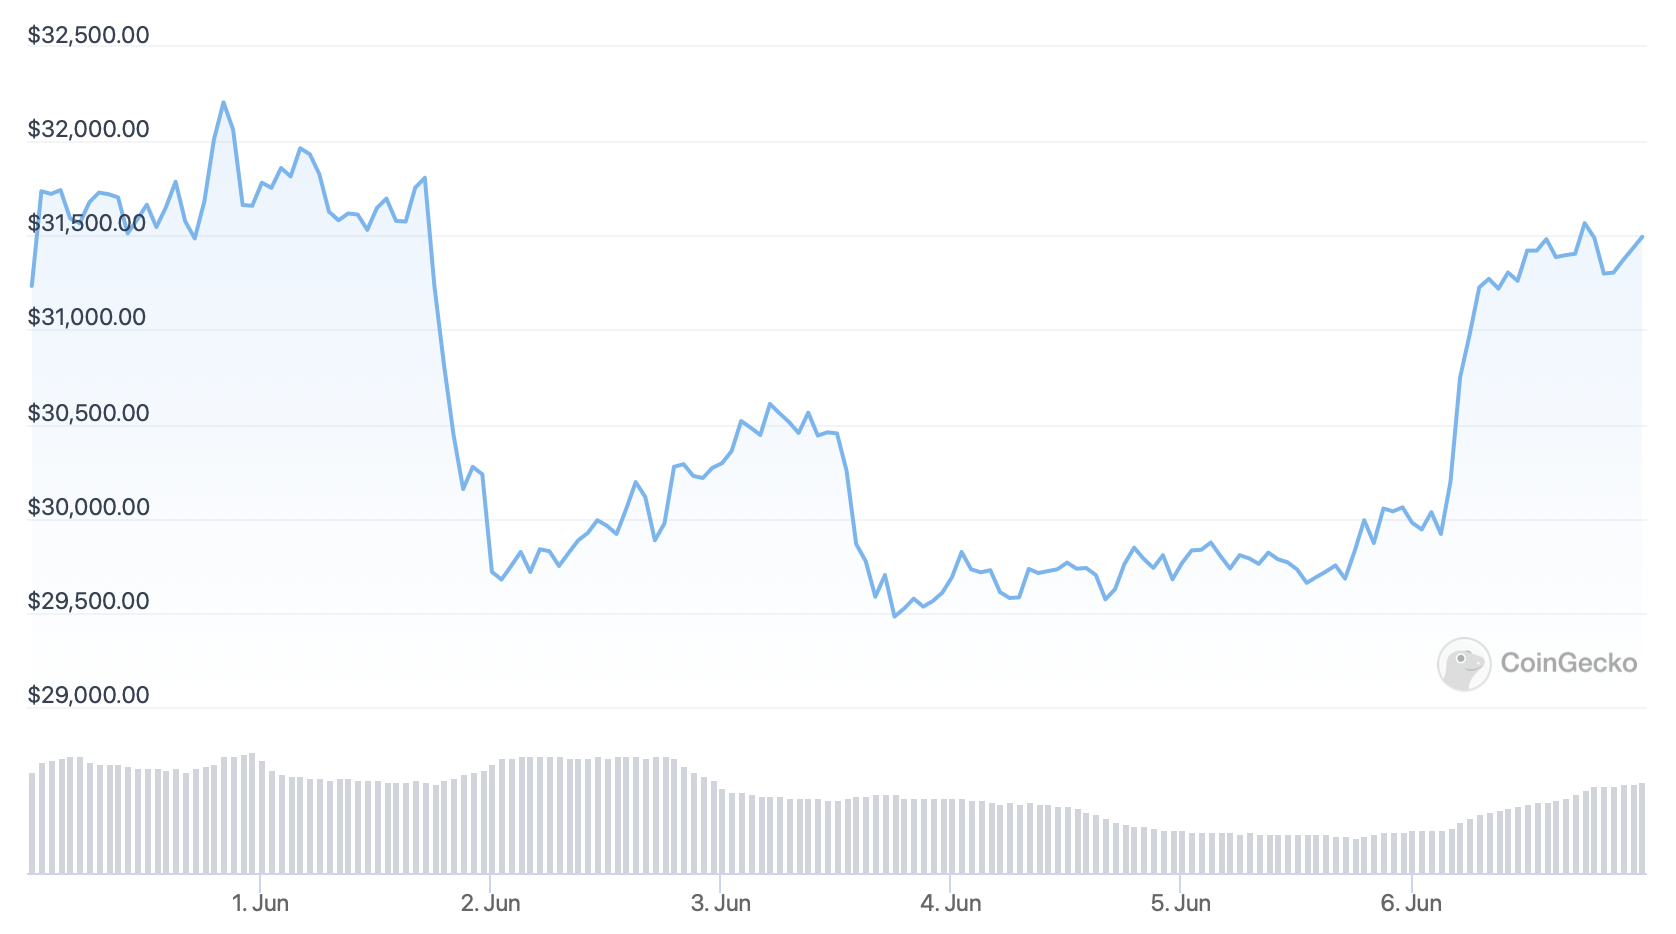
After gaining over $1,000, BTC topped out at $32,206.26 on Tuesday, May 31. Next came a crash below $29,700, an uptick, and the 7-day low of $29,479.74 on Friday evening (June 3). On Monday, June 6, BTC surged again.
The Crypto Fear & Greed Index is still bogged down in extreme fear. A similar pattern preceded a brief price hike in January, and BTC’s growth past resistance ($31,000) also hints at a possible bull run. The options market indicates a 63% probability that BTC will trade above $28,000 in July.
As of now, BTC is trading at $31,461.82, with a 24-hour gain of +4.6% and a 7-day change of +6.8%.

Deposit BTC to the CoinLoan Interest Account to earn up to 7.2% APY or use it as collateral for Instant Loans!
ETH price
Like BTC, ETH peaked on Tuesday, May 31 ($1,996.80) before slipping on Friday, June 3 ($1,751.16). Generally, it fared worse, gaining less than 3%. Its Monday’s spike on June 6 was also noticeably weaker.
The uptick from $1,737 on June 3 indicated buyers’ efforts to defend critical support at $1,700. If the bulls take over, ETH could rally above $2,000.
As of this writing, ETH is trading at $1,861.42, with 24-hour growth of +2.0% and a 7-day gain of +2.6%.

Use ETH for Instant Loans without credit checks or earn up to 7.2% APY with the CoinLoan Interest Account!
XRP price
On Tuesday, May 31, XRP rallied to $0.427461. It followed BTC’s pattern but saw a stronger upswing before crashing to $0.386369 on Friday, June 3. The token’s 7-day result mirrors ETH.
The bearish pressure is still significant. Negating it could allow XRP to approach the psychological level of $0.50. In the opposite scenario, it may fall to support at $0.28 (the current support level is at $0.34).
As of now, XRP is trading at $0.399799, with a minuscule 24-hour change of 0.1% and a 7-day rise of 2.6%.

Get up to 7.2% APY on XRP in your CoinLoan Interest Account or get an instant crypto-backed loan!
Cryptocurrency news
BTC’s first green weekly candle in 10 weeks
Last week, BTC investors had a reason to rejoice – the weekly chart showed the long-awaited green candle. It followed a 9-week retracement, and a bull run looks possible.
BTC’s daily and weekly performance is in the green. The cryptocurrency has broken past the pivotal and persistent level of resistance at $30,000. The trading volume is also up by over 50%, as usually happens at the start of a new week.
Furthermore, the gloomy trader sentiment (comparable to March 2020) has an upside. After three waves of shrinking dominance, traders are increasingly skeptical about buying the dip. Historically, such moments have galvanized the price.
That said, there is still some bearish momentum, and it must be overcome for the bull run to commence. Here are two confirmations to look out for.
First, breaching the next resistance level ($33k) would push the price above its 9-week exponential moving average (9 EMA). Currently, the latter is still under 20 EMA, which indicates some selling pressure.
Secondly, the RSI (Relative Strength Index) line, now sloped positively towards the RSI simple moving average (SMA), must break above it. If the price stays above 9 EMA, a minor bull run will be plausible. If 9 EMA crosses 20 EMA, investors can expect a series of consecutive upswings.
June reveals a silver lining for crypto market
May 2022 brought one of the most severe market crashes in the wake of the Fed’s decision to raise interest rates by 0.5%. Previously, cryptocurrencies showed a feeble correlation with real-world events and equities. Yet, although BTC seems to have developed a peg to S&P 500, the situation isn't all doom and gloom.
The correlation can be attributed to three factors: inflation fears, the Russia-Ukraine conflict, and the general market cap growth since 2020. More equity investors have flocked to crypto, causing the markets to overlap. Next came UST’s unpegging and USDT’s drop to $0.95.
Now, the stablecoin market has encouraging news. The ten biggest whale addresses of Dai (DAI) and USD Coin (USDC) indicate growing trust in these assets, along with Binance USD (BUSD).
These three stablecoins have benefited from UST’s fall from grace. It has triggered a crucial reshuffling as massive capital left USDT and UST (now USTC, or TerraUSD Classic). In May, BUSD came close to a $19 billion market cap. Meanwhile, talks of LUNA 2 — a LUNA upgrade — are infusing new optimism, and the project’s GitHub is brimming with activity.
Although whales still hold a modest amount of BTC, the number of such addresses (100–1,000 BTC) is rising. It has been growing for four consecutive months.
There is also some good news for the Ethereum community. The notorious gas fees are approaching year lows due to the stagnancy among blockchain networks. This makes an isolated dump less likely. In particular, Dai’s velocity (the average number of times a coin changes wallets daily) is now relatively low.